Define the Research Problem
Clearly identify the research problem that you want to address through data collection.
The research problem is a specific issue that a researcher wants to investigate and find answers to through a research study. It is the starting point of any research project and sets the direction for the entire study. The research problem should be clearly focused, addressing a problem that needs to be solved.
To explain it in simpler terms, imagine you are curious about a problem that needs to be understood better. The research problem is like a puzzle that you want to solve then you want to find an answer to. It guides the entire research process, from formulating hypotheses to collecting and analyzing data, and helps in drawing meaningful conclusions.
For example, let’s say you are interested in understanding the factors that influence customer satisfaction in a particular industry. The research problem could be: “What are the key factors that contribute to customer satisfaction in the Education industry?”. This problem will guide your research and help you gather relevant data, analyze it. And draw conclusions about the factors that impact customer satisfaction in that industry.
Design the research

Determine the research design, which includes deciding on the type of data to be collected (primary or secondary), the methods of data collection, and the sampling technique.
To design a research study, there are several important steps to consider. These steps will help to ensure that your research is conducted in a systematic manner. Basically, here is the research design process:
- Identify the research problem: Start by clearly defining the problem or question you want to investigate. This will guide your entire research process.
- Determine the research objectives: Once you have identified the problem, establish specific objectives. That you want to achieve through your research. These objectives should be clear and measurable.
- Choose the research method: Decide on the appropriate research method based on the nature of your research problem. There are different methods available, such as surveys, experiments, interviews, and observations. Each method has its own advantages and limitations, so choose the one that best suits with your research objectives.
- Select the sample: Determine the sample size and sampling technique which will be used to collect data. The sample should be representative of the population you are studying.
- Develop research instruments: If you are using surveys or questionnaires, design the questions in concise manner. Make sure the questions are easy to understand and do not lead to biased responses. If you are conducting interviews, prepare a set of questions to help in the conversation.
- Collect data: Put your research plan and collect data from your chosen sample. This may involve administering surveys, conducting interviews, or observing and recording data.
- Analyze and interpret data: Once you have collected the data, analyze it using appropriate qualitative methods. This will help you draw conclusions and make sense of the findings. Data analysis involves examining each component of the data, interpreting the findings in the given context, and presenting the results in a logical manner.
- Test hypotheses (if applicable): If you have formulated hypotheses, compare the measured values obtained from your data to the values implied in the hypotheses. If the values are consistent, your hypotheses are supported. If not, they are rejected.
- Draw conclusions: Based on your analysis and interpretation of the data, draw conclusions about your research problem. Provide recommendations for future research or practical applications based on your findings.
- Report the research: Finally, document your research process, findings, and conclusions in a clear and organized manner. This can be done through a research report, presentation, or other appropriate formats.
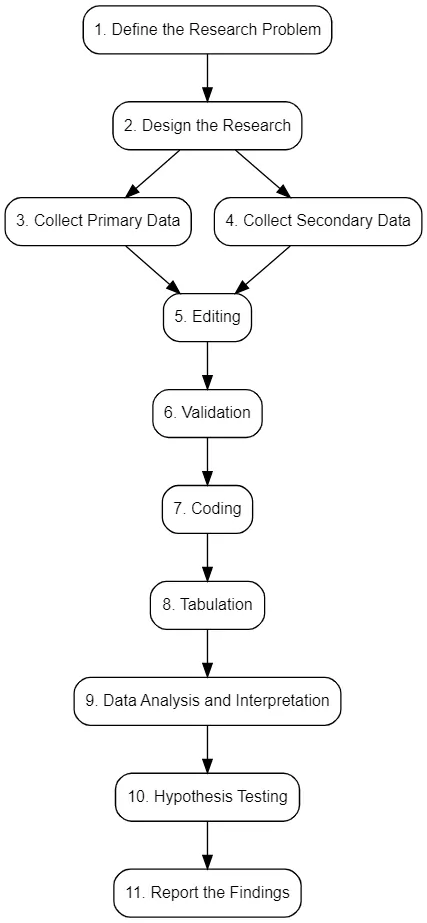
Collect Primary Data
If primary data is required, choose one or more methods to collect it. Some common methods include:
- Observation Method: This method involves observing people in a specific setting and recording the data. For example, if you are studying customer behavior in a retail store, you can observe how customers interact with products, how they move around the store, and other relevant behaviors. This method allows you to gather data in a natural setting. And can provide valuable insights into actual behavior.
- Interview Method: The interview method involves asking questions to individuals either in person (personal interview) or over the phone (telephone interview). In a personal interview, the interviewer meets the respondent face-to-face and asks questions. This method allows for more in-depth responses. And the opportunity to clarify any prediction. In a telephone interview, the questions are asked over the phone, which can be a more convenient and cost-effective method for collecting data.
- Questionnaire Method: The questionnaire method involves distributing a set of questions to respondents and collecting their written responses. This method is commonly used in surveys and allows for standardized data collection. Questionnaires can be sent by mail, email, or administered online. This method is efficient for collecting data from a large number of respondents and allows for easy data analysis.
- Schedule: A schedule is a structured form or questionnaire that is filled out by the researcher based on the responses provided by the respondents. This method is often used in face-to-face interviews where the interviewer records the responses directly on the schedule. It ensures consistency in data collection and allows for easy comparison and analysis of responses.
Collect Secondary Data
If secondary data is required, gather information that has already been collected and analyzed by other sources. This can include published articles, reports, statistical synopses, and other relevant sources.
Secondary data refers to data that has been collected and analyzed by someone else for a different purpose. It is information that already exists for researchers to use in their own studies. Secondary data can be collected from various sources such as published articles, reports, statistical synopses, census records, and official statements from government departments. It can also include research works conducted by teachers, professionals, and records maintained by private business.
There are several advantages to using secondary data, it is accessible as it is already available in various sources. Researchers do not need to spend time and resources on collecting the data themselves. It is cost-efficient as there is no need to spend money on data collection. It is less time-consuming as the data is already collected and ready for analysis.
Additionally, secondary data provides a large amount of information, which can be beneficial for researchers.
However, there are some limitations to using secondary data. One limitation is the authenticity of the data. Since it is collected by someone else, there may be concerns about the accuracy and reliability of the data. Researchers need to check the source of the secondary data before using it in their own studies.
Another limitation is the availability of relevant data. Because researchers may not always find the exact data they need for their specific research question.
Editing
Review the collected data for errors, omissions, or inconsistencies. Make necessary corrections to ensure the accuracy and completeness of the data.
Editing is an important process that can be carried out during or after a field survey. There are two main types of editing: field editing and central editing.
Field editing is done while the survey is still ongoing. It involves examining the collected data for errors and making necessary corrections. This is important because sometimes the information gathered during data collection may lack uniformity.
For example, there may be example where responses are not properly recorded or some questions are left unanswered. Field editing helps ensure that the data is accurate and reliable.
Central editing, but, it is done when the questionnaires have been received at the headquarters. It involves a more thorough examination of the collected data to identify any errors. This step is crucial in ensuring the quality of the data before further analysis.
During the editing process, it is important to treat the information gathered as confidential. The questions in the questionnaire should be worded, simple, and clear to avoid any confusion for the respondents.
The order of questions is also important. It also lead questions designed to create interest and difficult or personal questions placed towards the end. The questions should be organized in a logical order to help a smooth flow of responses.
Validation
Examine the quality and accuracy of the collected data before processing and analyzing it. This step ensures data integrity and credibility
Validation is the process of ensuring that the data collected in a research study is accurate, reliable, and trustworthy. It involves checking the consistency of the data to ensure that it reflects the true nature of the event being studied.
In simple terms, validation is like double-checking the information to make sure it is correct. It is important because if the data is not valid, it can lead to incorrect conclusions.
Validation can be done in various ways. One common method is to compare the data collected with other sources of information to see if they align. This helps to verify the accuracy of the data.
Another way to confirm data is through cross-checking and verification. This involves reviewing the data for any inconsistencies, errors, or missing information. By examining the data, researchers can identify any discrepancies and take steps to correct them.
Validation also involves ensuring that the research instruments, such as questionnaires or interview protocols, are designed and measure what they intend to measure. This helps to ensure that the data collected is relevant and reliable.
.
Coding
Classify the answers to questions into meaningful categories using codes. This step is necessary for next data analysis and tabulation.
Coding is a process used in research to classify answers to a question into meaningful categories. It involves assigning codes to responses, which are necessary for organizing and analyzing data. Without coding, it would be difficult to reduce a large number of diverse responses into meaningful categories, resulting in weak and ineffective data analysis.
The coding process requires treating information and ensuring that questions are worded, simple, and clear. The sequence of questions is also important. By following a logical order, the coding process becomes more efficient.
In coding, two steps are involved. First, the different categories or classes into which the responses will be classified need to be specified. Second, individual answers are allocated to these categories. Each response should be classified in one and only one category. Although there may be cases where more than one dimension is embodied in a single response. There is no fixed rule on how many categories should be used; it depends on the nature of the data and research objectives.
Tabulation
Tabulation is a process that involves organizing and summarizing raw data in a structured and concise manner. It is used in statistical analysis to present data in the form of tables, which make it easier to understand and analyze the information.
The main purpose of tabulation is to provide an view of the findings in a simplified way. By arranging the data in columns and rows, tables help to identify trends and display relationships between different parts of the findings. This allows researchers and readers to compare and interpret the data.
There are different types of tabulation depending on the number of variables involved. Univariate tabulation is used when analyzing data from a single variable, while bivariate or multivariate tabulation is used when analyzing data from two or more variables.
Cross-tabulation, also known as cross-tab or contingency table. It is a specific type of tabulation used for categorical data. Categorical data consists of values that are exclusive to each other. Cross-tabulation helps to identify patterns, trends, and correlations between different factors within a study.
To carry out tabulation, it is important to code the data. Coding involves classifying the answers to a question into meaningful categories using codes. This step is necessary to organize and analyze the data. Without proper coding, it would be difficult to reduce a large number of diverse responses into meaningful categories, resulting in weak and ineffective data analysis.
Data Analysis and Interpretation
Analyze the data to draw conclusions and interpret the findings. This involves examining each component of the data, explaining the meaning of the findings in the given context, and also presenting the results in a logical manner.
Data analysis is the process of examining and understanding data to a meaningful conclusions. It involves categorizing, manipulating, and summarizing data to answer important questions. The purpose of data analysis is to make the data easier to interpret and to identify patterns or trends within the data.
Data interpretation involves reviewing the analyzed data and drawing relevant conclusions based on various analytical methods. It is the process of explaining what the findings mean in the given context. This step is crucial to make sense of the data and make informed decisions based on the results.
There are different types of data analysis techniques. Univariate analysis is the simplest form, where data with only one type of variable is analyzed. The main aim of univariate analysis is to describe the data and find patterns within it. This is done by looking at measures such as mean, mode, median, standard deviation, and dispersion. Tables, charts, polygons, and histograms are used to display the results of univariate analysis.
Hypothesis Testing
If applicable, test the research hypotheses by comparing the measured values obtained in the sample with the values implied in the hypothesis. This step helps in determining whether the hypothesis is supported or rejected.
Hypothesis testing is a statistical method used to determine if the results of a survey if they could have occurred by chance. It helps researchers assess the validity of their findings and determine if they can be replicated.
The process of hypothesis testing involves several steps. First, the researcher formulates a hypothesis based on their research objectives. The hypothesis should be specific and clearly state the relationship between variables.
Next, the researcher collects a sample of data and measures the relevant variable. The measured value is then compared to the value implied by the hypothesis. If the measured value is consistent with the hypothesis. it provides support for the hypothesis. However, if the measured value is not consistent with the hypothesis, the hypothesis is rejected.
In hypothesis testing, there are two types of hypotheses: the null hypothesis and the alternative hypothesis. The null hypothesis is the hypothesis that the researcher believes to be true. The alternative hypothesis is the opposite of the null hypothesis and is considered to be untrue. These two hypotheses are exclusive, meaning that only one can be true.
For example, if a researcher wants to test whether a penny has a 50% chance of landing heads, the null hypothesis would be that it does have a 50% chance, while the alternative hypothesis would be that it does not. The null hypothesis would be represented as “Ho: P = 0.5” and the alternative hypothesis as “Ha: P ≠ 0.5”.
Report the findings
Present the results of the data analysis and interpretation in a clear and concise manner. This step involves organizing and presenting the data, discussing the implications, and drawing conclusions based on the research objectives.
Reporting the findings refers to the process of presenting the results of a study or research in a clear and organized manner. It involves summarizing and interpreting the data collected, and presenting the key findings to the intended audience.
The purpose of reporting the findings is to communicate the results of the study, provide evidence to support or reject the hypothesis. And contribute to the existing knowledge in the field. When reporting the findings, it is important to follow a structured format and include relevant information. Such as the research question, methodology, data analysis techniques, and the main results.
This can be done through various means, such as written reports, presentations, or visual representations like tables, charts, and graphs. The findings should be presented in a logical and coherent manner, highlighting the most important results and their implications. It is also important to provide enough context and background information. To help the audience understand the significance of the findings.
Leave a Reply